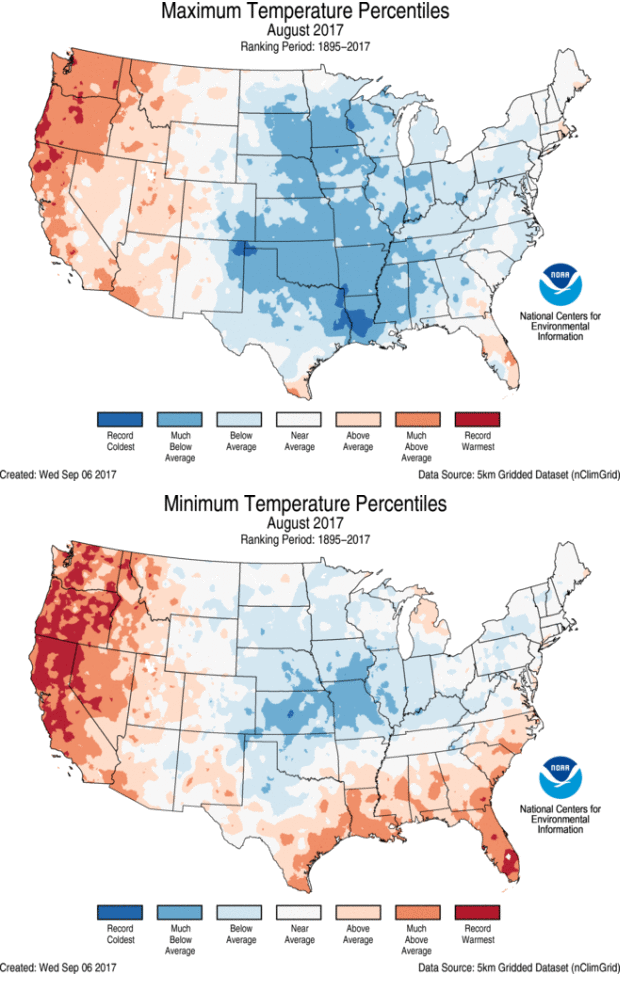
 This picture shows the possible temperatures we will experience this August. The top being the Maximum and the bottom being the minimum. 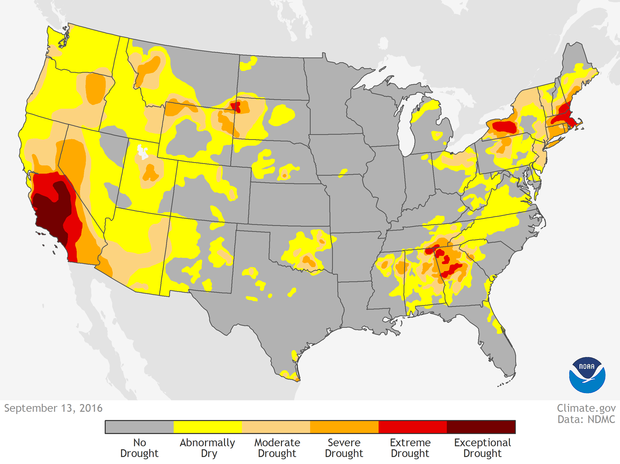 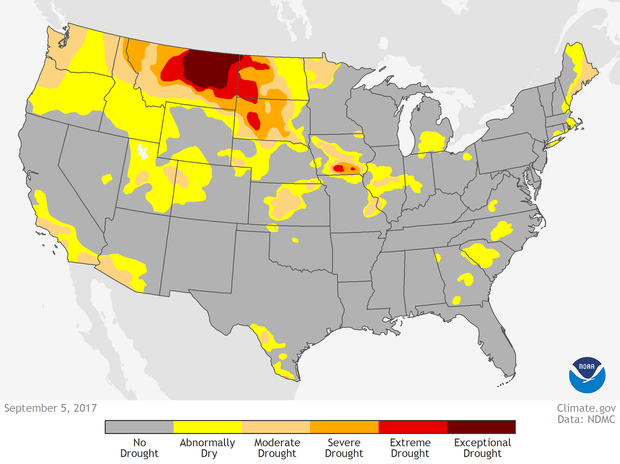 These data maps show the droughts that were present in America about a year apart. 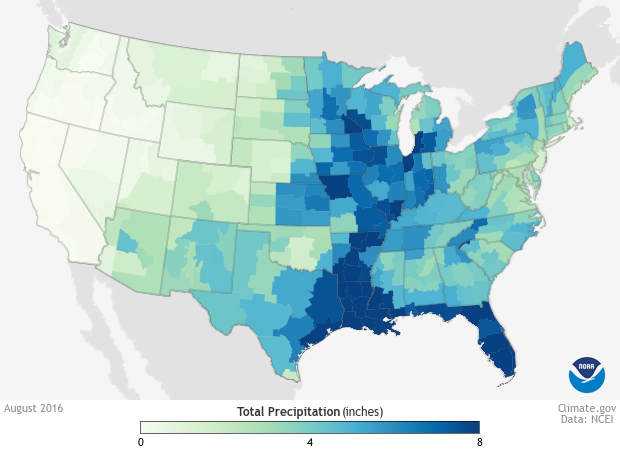 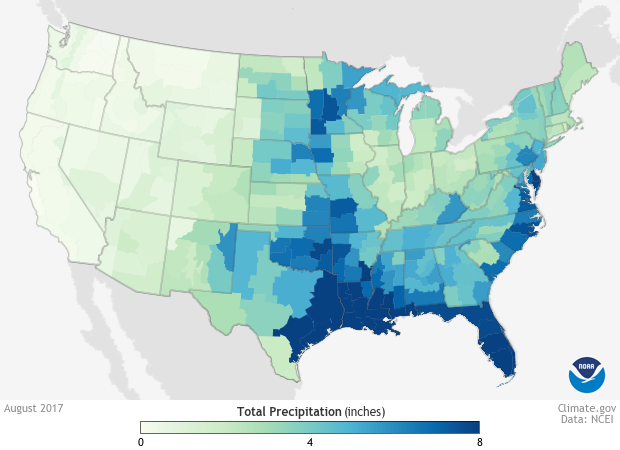 These two pictures show the average precipitation in America, a year apart.
0 Comments
|
Author's NoteLive and Love The Process ArchivesCategories |
 RSS Feed
